Contents
Overview
Adjustment of the calibration and levels of the RGB module in the Philips VP415 is required if repairs or modifications are made to either the RGB module (B) or the Analogue I/O module (U). Furthermore, since the player is quite old, settings tend to drift over time so recalibration will greatly improve the picture produced by the player.
The service manual provides instructions for the recalibration of the module, however they lack detail and can be hard to follow. This guide should be used as an addition to the service manual when calibrating the module. Please note that the author does not guarantee accuracy and, as with any modification to the player you run the risk of inadvertently breaking your VP415. Please ensure that you use the correct ESD protection when performing any service work on the VP415.
Prerequisites
To perform the calibration and adjustment of the VP415 RGB module you will need a Laservideo disc containing a colour test pattern. The service manual indicates that this is picture number 6200 on the official Philips 6-inch test disc; however, these discs are now almost impossible to source.
As an alternative, you can use a limited edition copy of Jason and the Argonauts. The PAL CAV version of this 2-disc set has a set of test patterns on side 4 (disc 2 side 2). The required pattern is frame 51420.
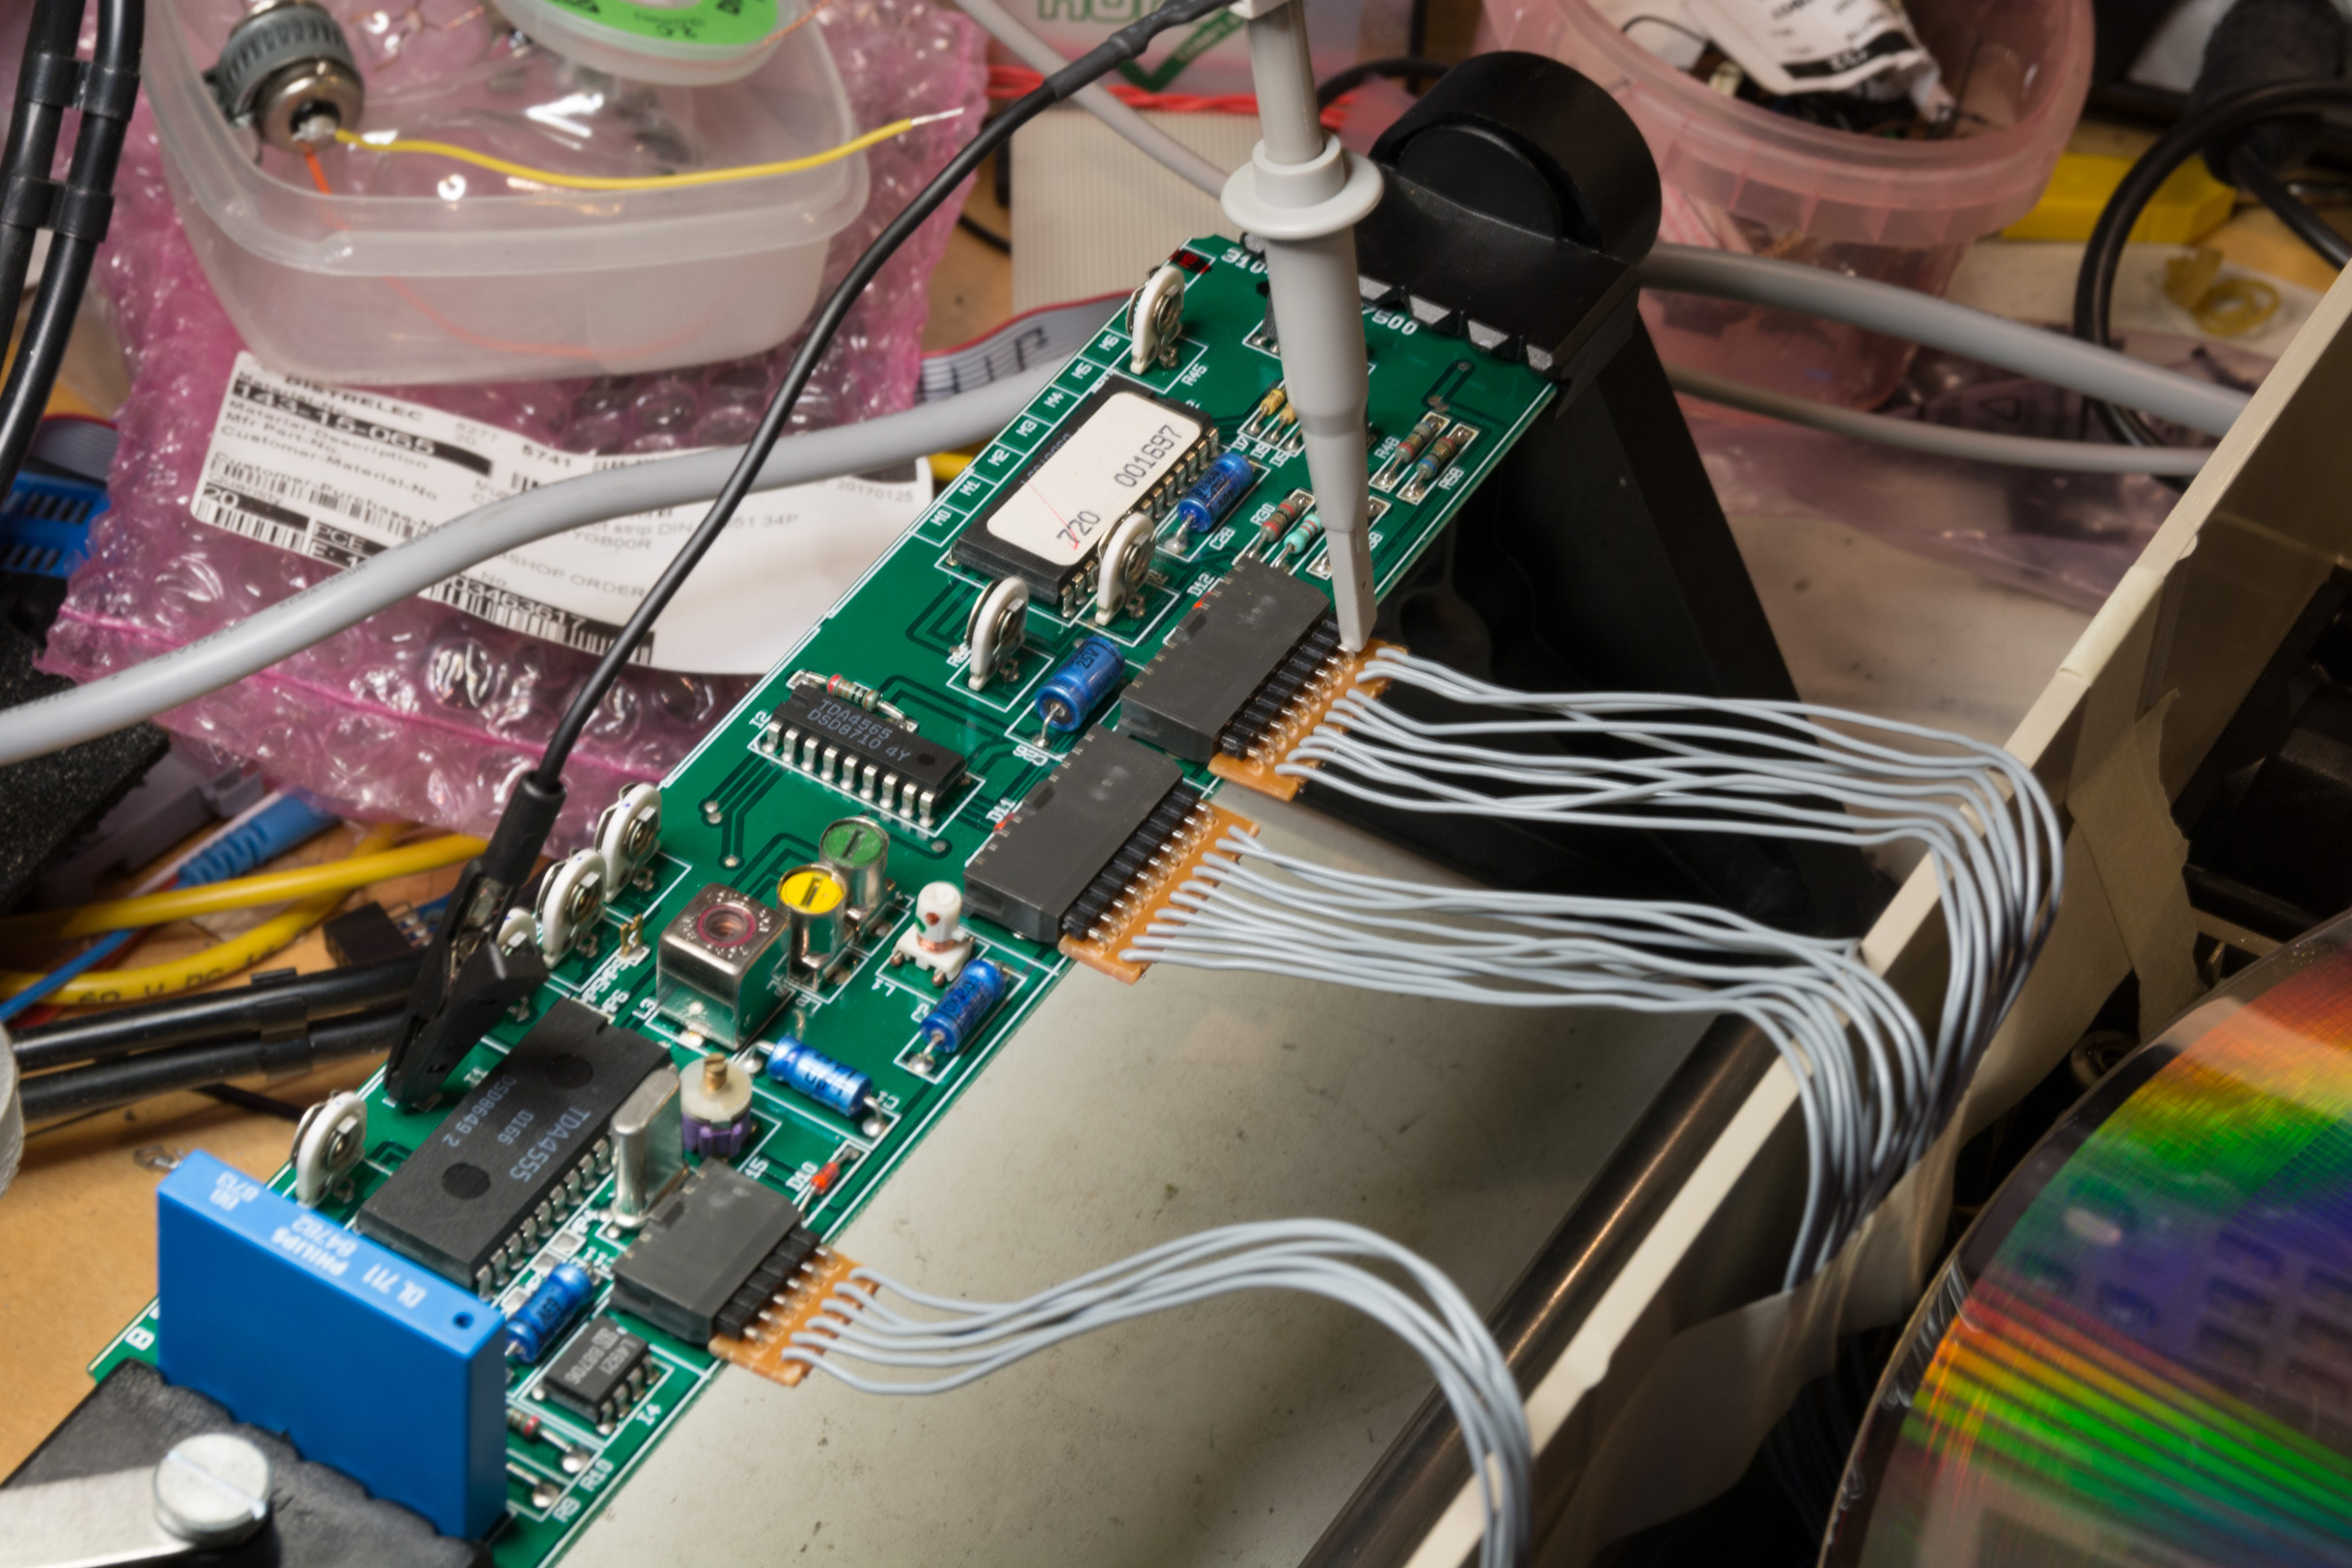
As the RGB module will be underneath a normal size laserdisc it is necessary to remove the module and use temporary extended connectors to connect the module to the backplane of the player. The connections are 2x10 pin SIL (2.54mm pitch) and 1x6 pin SIL. This is a common pitch of connector and it is possible to make using Dupont style plugs (or pretty much any 2.54mm pitch SIL plugs). You will need to make the cables male to female so they can be connected to the RGB module as shown in the following picture (make sure the cables are the correct way around!):
To hold the disc in place whilst testing it is a good idea to use a magnetic spindle lock as shown by the service manual (‘Disc clamping piece’ 4822 532 60775), however this part is no longer available. Instead there is a STL 3D model of an alternative holder available here that can be 3D printed.
Since the upper-deck of the player is removed during this procedure you will also need a ‘front loader simulation’ part (4822 267 50706). This causes the player electronics to detect the disc tray is closed. This can be made by simply placing a 2.54mm jumper onto the drive processing module R between pins 3 and 4 of the R3 connector on the top-right of module R.
You will also require a 2-channel oscilloscope to make the required measurements and some small flat screwdrivers to adjust the various potentiometers and variable induction coils on the RGB module. A collection of small test probe clamps and attachments also assists with connecting the scope to the various test pins.
Adjustment points
The following picture shows the component-side of the RGB module and the location of the various adjustment points:
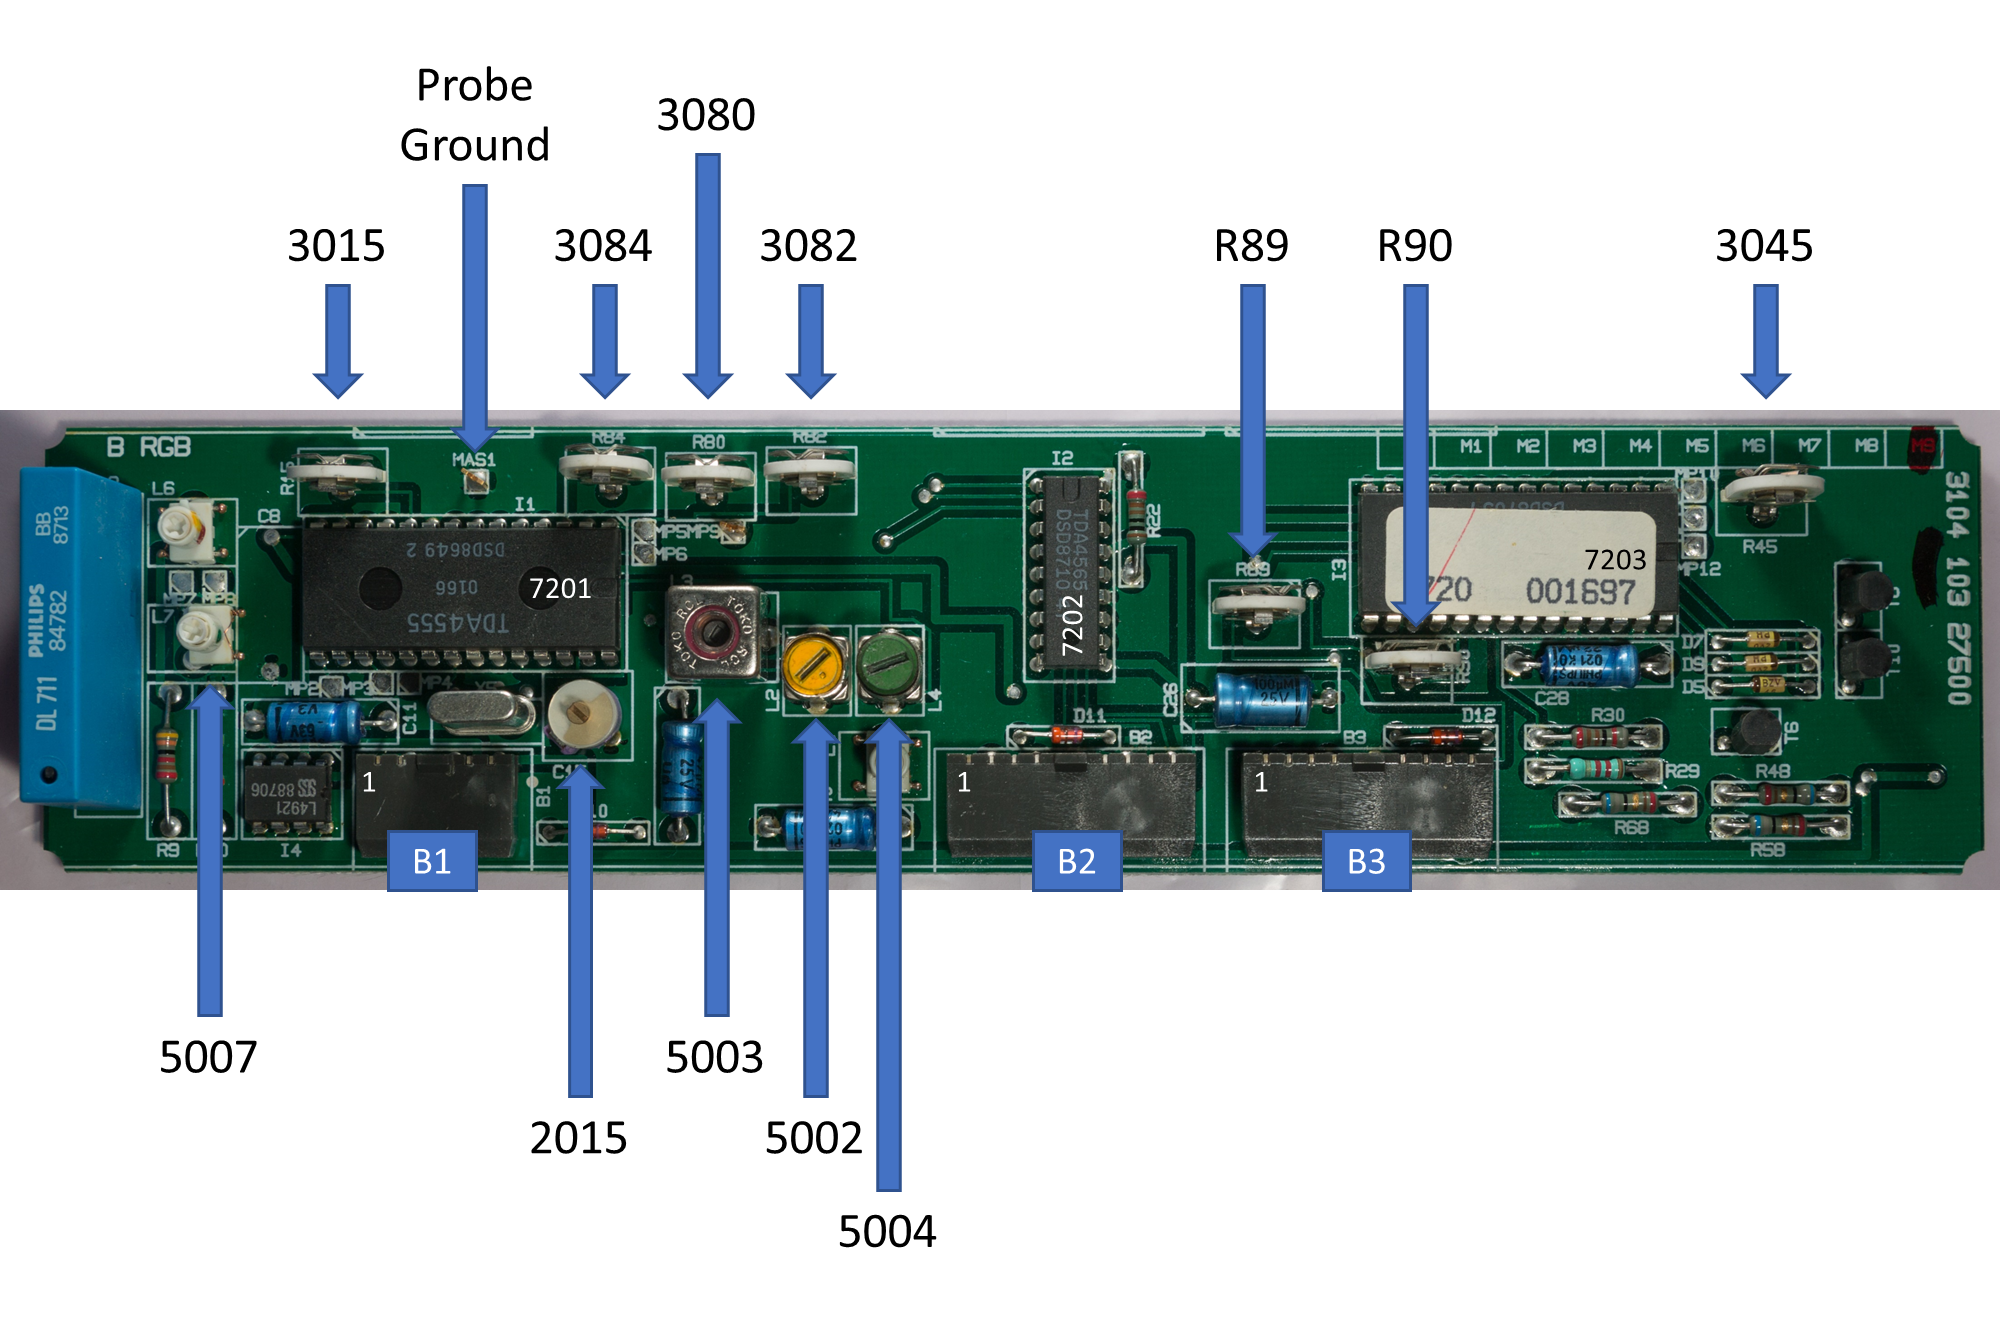
Note that this is a modification level 9 board and, unlike the board in the service manual, it has two additional potentiometers marked R89 and R90 that are not present in the documentation.
R89 is connected to pin 16 of 7203 and controls the saturation of the picture (i.e. the overall amplitude of the red, green and blue signals). R90 is connected to pin 19 of 7203 and controls the contrast of the picture (i.e. the peak-to-peak gain of the video signal). If these extra potentiometers have not been adjusted it’s probably safe to leave them as-is. Otherwise adjust both to their centre-points (you can do this by simply looking at the position of the potentiometer). Since both affect the overall output, it’s better to do this first before any other adjustments.
Setting up the oscilloscope
All the measurements required for the calibration are video signals coming from various points of the module. To reproduce the traces shown in the service manual it is necessary to trigger the oscilloscope based on the video ‘lines’ (this is what the service manual refers to as ‘line triggered’). To do this connect the first channel of the oscilloscope to 1B1 (pin 1 of connector B1) and earth the probe on 2B1.
Note that the service manual is a little confusing around this signal. For the RGB module B the CVBS input signal example is shown with a peak-to-peak of 2Vs and a base of 2.8Vs, however this signal is generated by module C and in the module C documentation the output to the CVBS signal is shown as being 2.6V peak-to-peak with a base of 3.5V. The signal is going to be based on the output from the Laserdisc itself (and discs other than the official Philips test disc will give slightly different results).
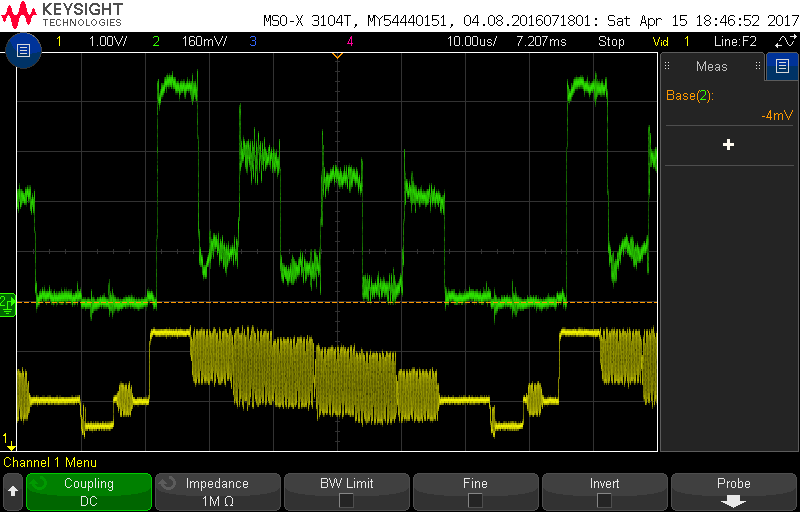
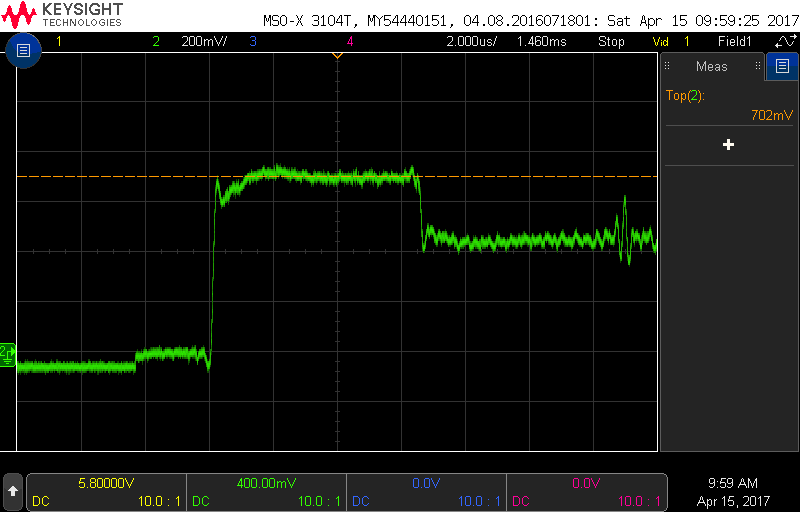
If your oscilloscope does not provide video signal triggering then you can use the edge of the signal under the base-line (i.e. the negative square sync pulse) to trigger the scope. In the following picture, you can see a capture of the expected signal; the channel offset has been placed at 3.5V causing the base of the signal to appear around the centre-line of the trace (note: a 30us delay is used to show the whole signal):
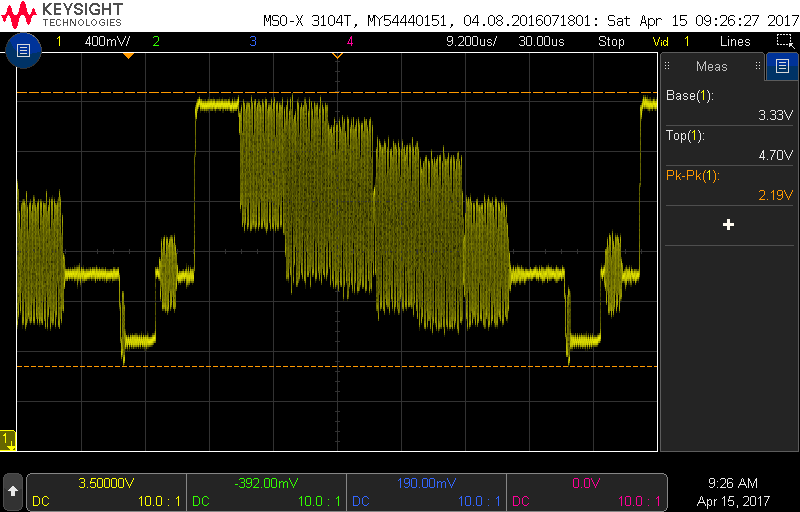
Once this signal is measured and confirmed it can be used as the trigger for the rest of the measurements. In the following sections channel 2 of the scope is used for the measurements with channel 1 used only for triggering (unless otherwise noted).
It should be noted that each ‘band’ in the trace above represents a colour in the test bar pattern (the trace is one line of the displayed output from the current frame). Starting with the negative square pulse (this is the video ‘sync’ pulse) the bars are white, yellow, cyan, green, magenta, red, blue and black respectively.
Adjusting the black-level
Since the black-level of the signal represents the base-line of the R, G and B-Signals it’s a good idea to adjust this first (otherwise the other measurements will be offset by this).
To measure the black-level connect channel 2 of the oscilloscope to pin 4 of connector B3 (this is the B-Signal). Ground the probe using the probe ground marked ‘MAS1’ on the module PCB. In the following trace, you can see the output from this. The original CVBS signal on channel 1 is included so you can see the relationship between the signals. Adjust B3045 until the base-line of the B-Signal is as close to 0V as possible (plus or minus 50mV):
Notch filter adjustment
To adjust the notch filter leave channel 1 of the oscilloscope connected (and triggering) on the CVBS signal (as shown above) and connect channel 2 of the oscilloscope to pin 10 of connector B3.
Now adjust 5002 until the chroma rests are as narrow as possible:
Next use the oscilloscope to zoom into the start of the positive peak (the long line from the base to the top of the signal shown in the previous diagram). Adjust 5003 until the under and overshoot of the line is as equal (in amplitude) as possible:
Bandpass adjustment
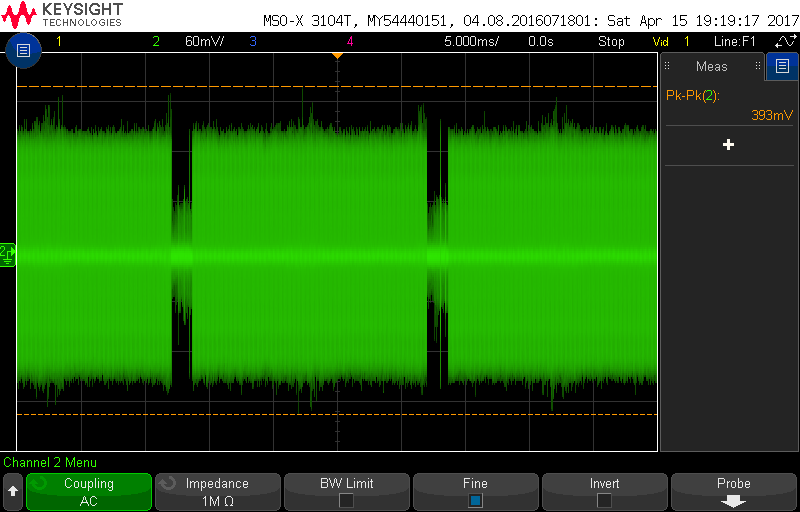
To perform the bandpass adjust leave channel 1 connected to the CVBS signal as per the previous steps. Using a test clip connect channel 2 of the oscilloscope to pin 15 of IC 7201 and set the channel to AC coupled. Adjust 5004 until the peak-to-peak range of the chroma signal is 0.4V including the overshoots:
Delay line adjustment
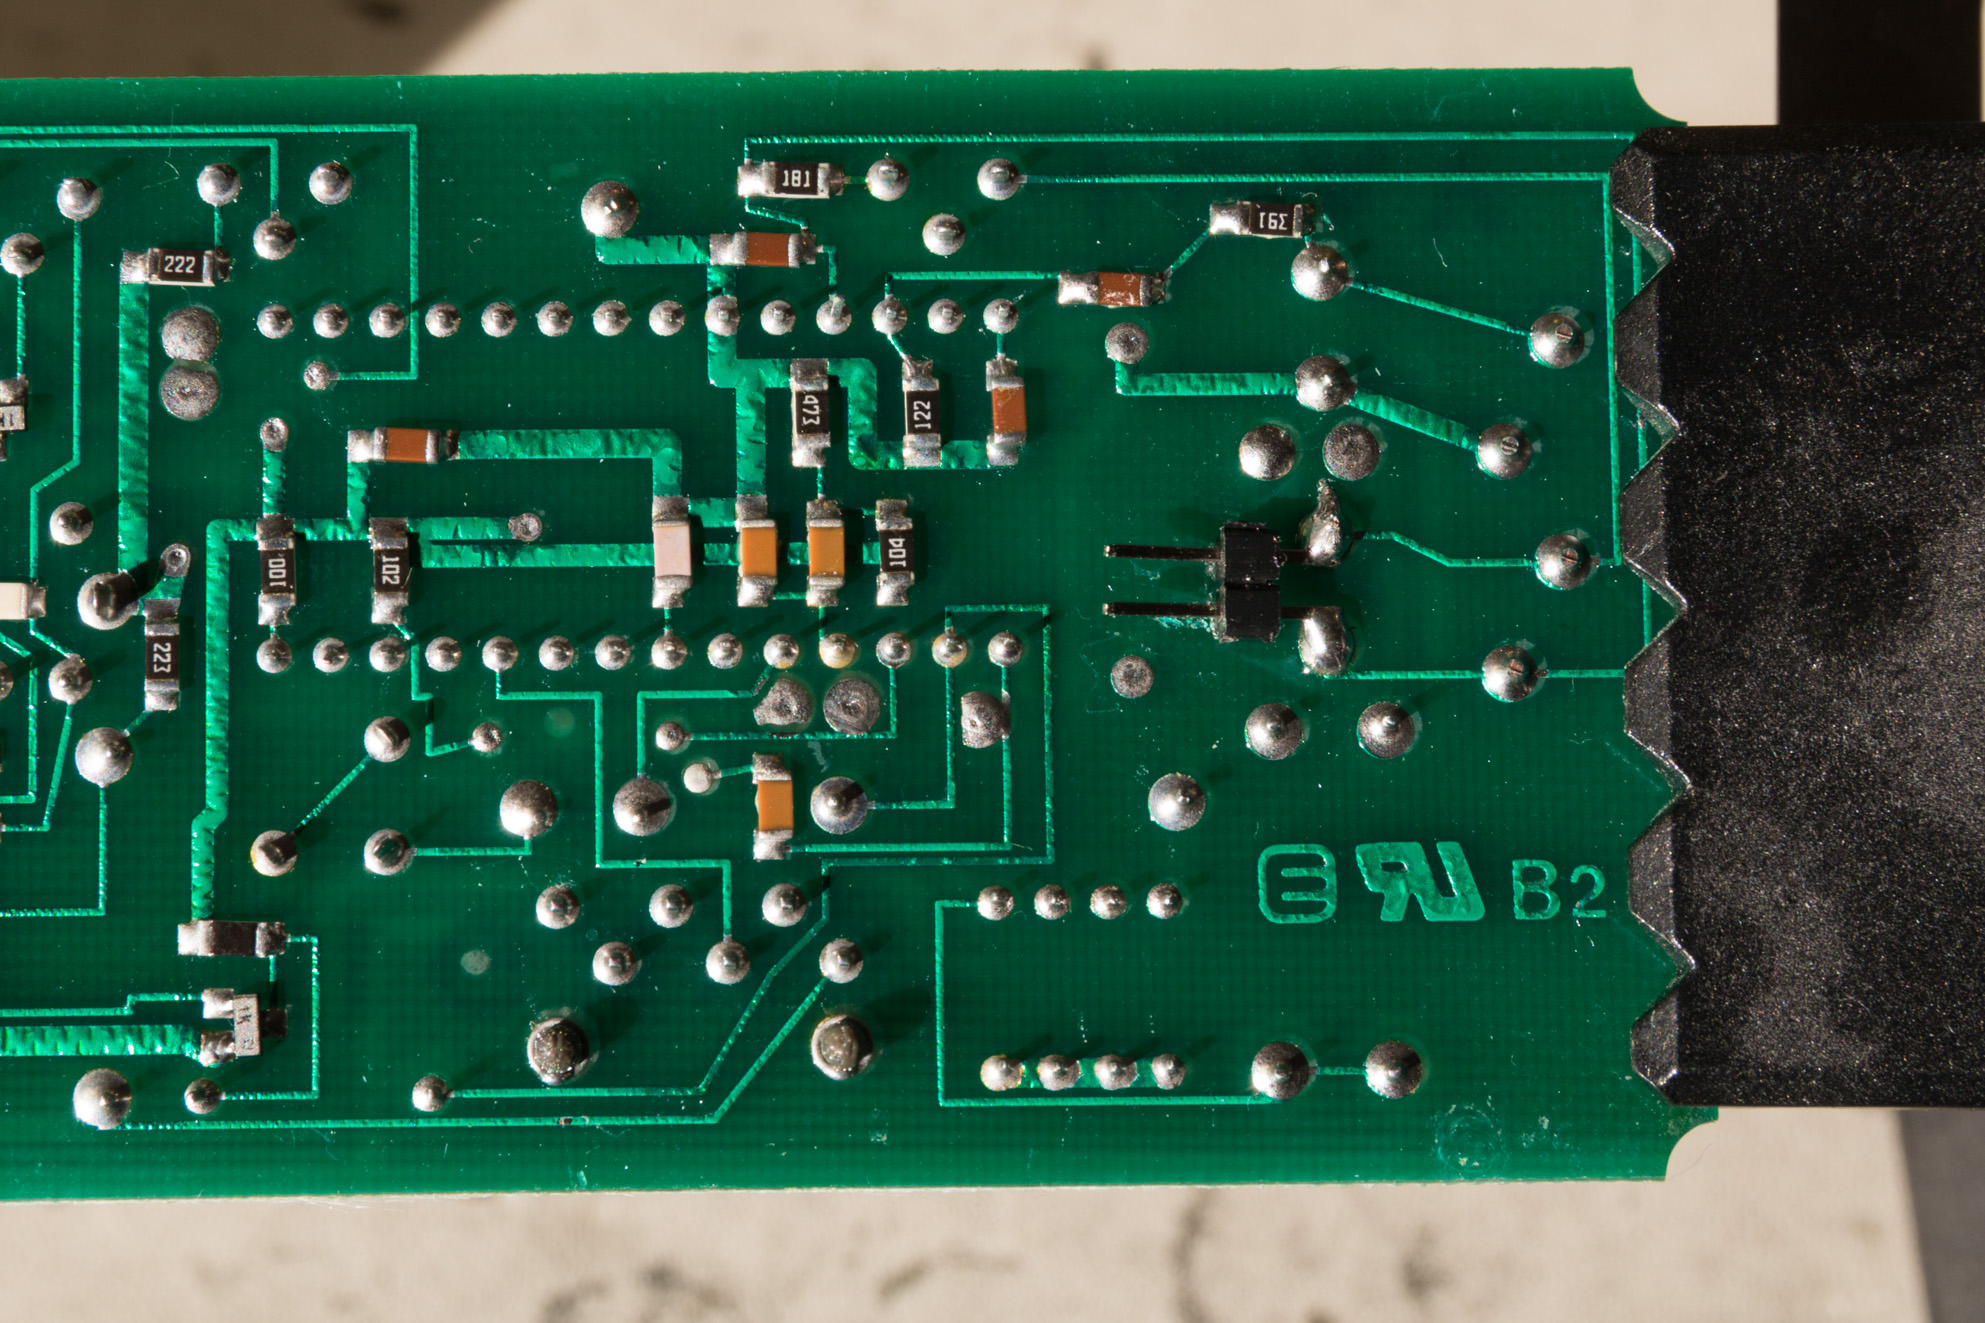
The delay line adjustment is a little tricky as it is designed to be performed using a video vectorscope which is no longer a common piece of equipment. Instead the test can be performed using an oscilloscope (but it is important that the scope configuration is correct). In addition this adjustment, and the following oscillator adjustment require the delay line (L5008) to be shorted in order to disable it. As there are no test points visible on the board the author suggests a simple (optional) modification to the board. In the following picture you can see a 2 pin 2.54mm header soldered to the back of the module between pins 3 and 4 of L5008. This allows a simple switch to be connected to the module when under test (so the delay line can be easily disabled and enabled). This modification can be left in place after adjustment for future use:
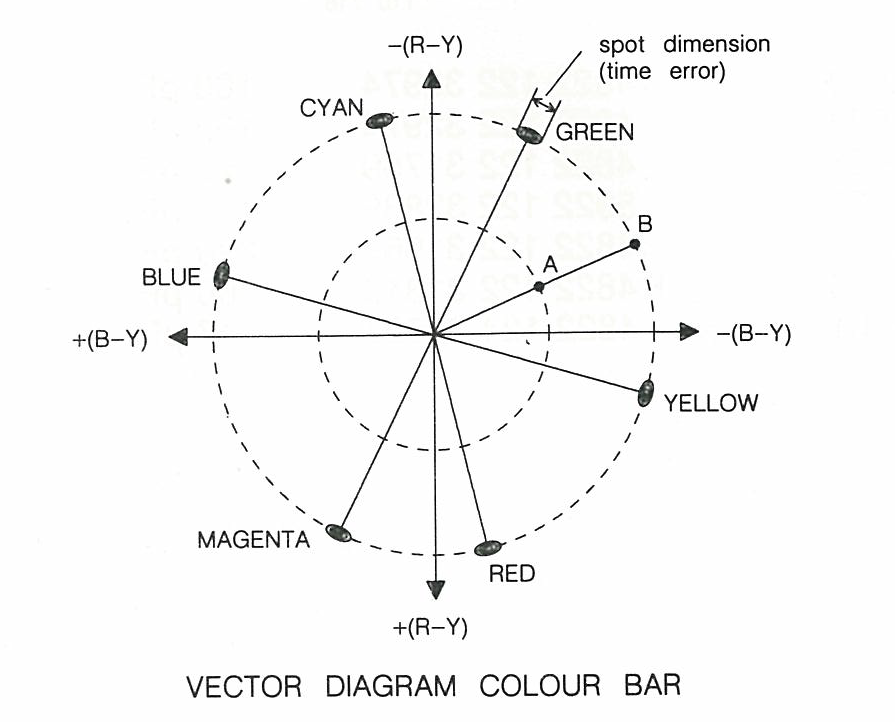
The VP415 service manual shows the following vector diagram which should be produced for the test colour bar pattern:
Connect channel 1 (X) of the scope to pin 9 connector B2 (this is the R-Y signal on the x-axis of the vector diagram) then connect channel 2 (Y) of the scope to pin 10 connector B2 (this is the B-Y signal on the y-axis of the vector diagram).
Switch both channels 1 and 2 into AC coupled mode and invert both channels (in the vector diagram the X axis runs from positive on the left and negative on the right, the same for the Y axis; this is the opposite of a normal scope in X-Y mode). Finally switch the scope into X-Y mode (in the horizontal settings).
Make sure both channels have zero offset and that the vertical and horizontal scaling is equal. If all goes well you should see the vector diagram on the oscilloscope:
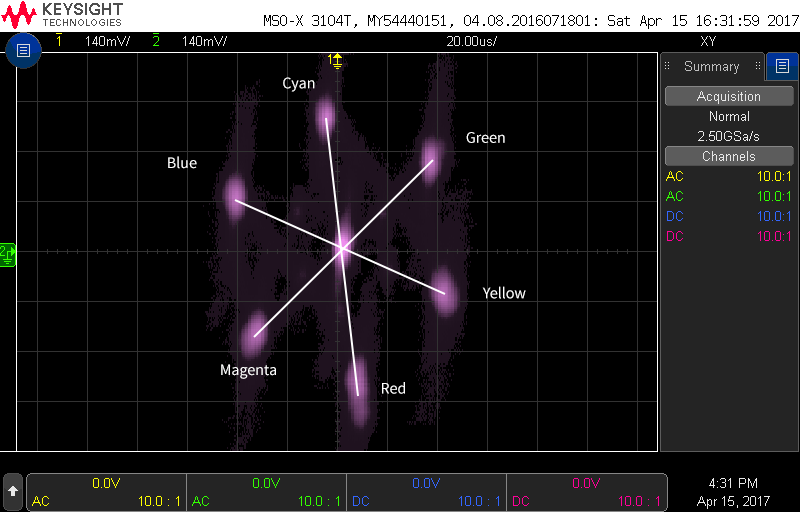
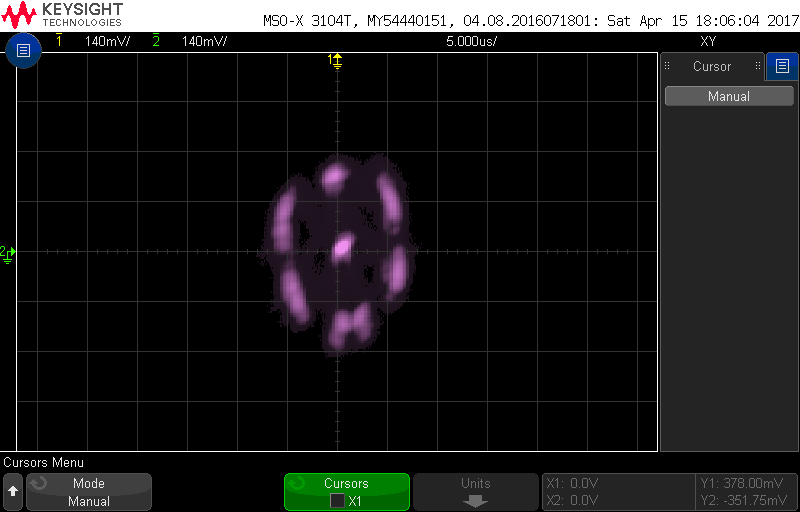
Now (with the delay line enabled) adjust 5007 until the overall dimensions of the ‘spots’ are as small as possible:
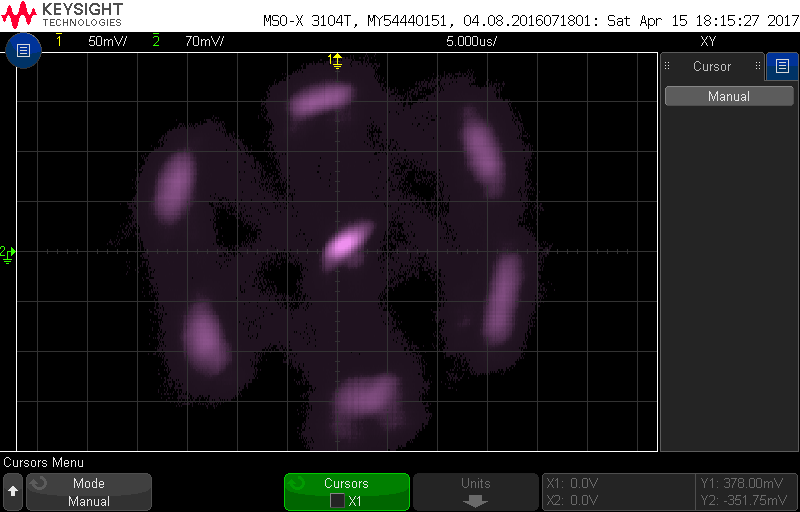
Next adjust 3015 until the distance between the spots on the vector diagram with the delay line on are twice as far as with the delay line off. To do this you should turn the delay line on and off and either measure the display with a ruler (between two opposite spots), or use the oscilloscopes cursors (if available). Once measured turn the delay line back on and adjust 3015 until the distance is double the previous measurement (note: 3015 has no effect on the signal when the delay line is off).
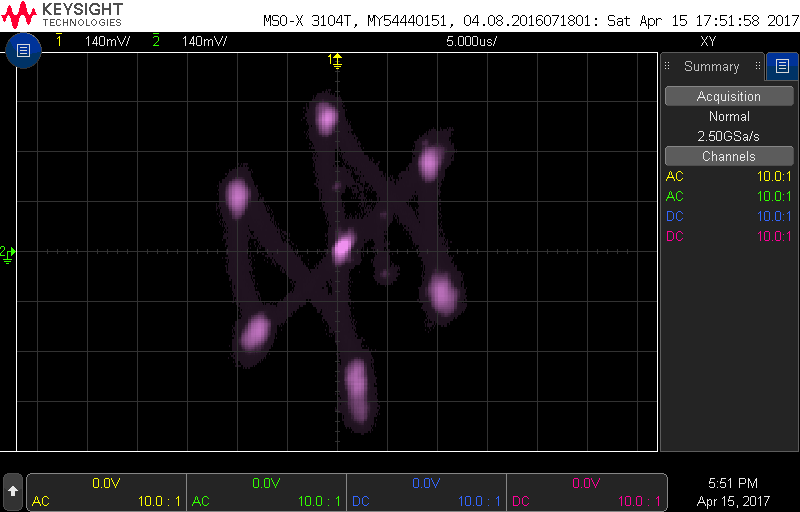
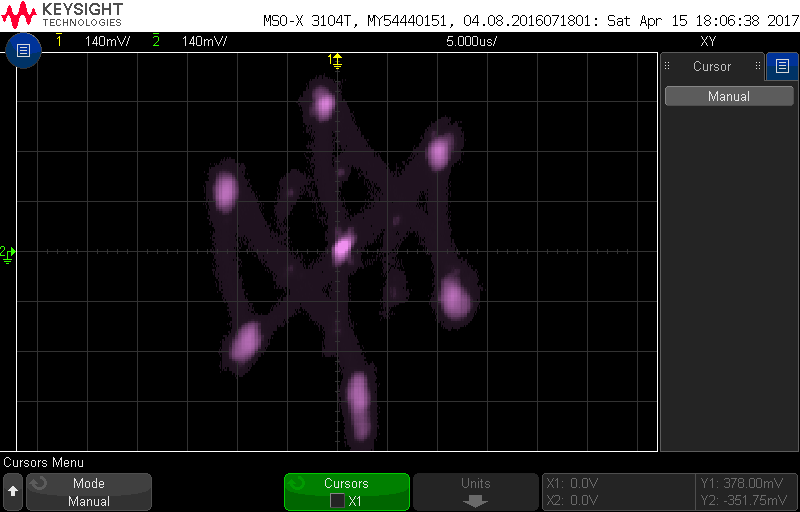
The following trace shows the vector diagram with the delay line disabled:
The following diagram shows the vector diagram with the delay line enabled (after adjustment of 3015):
Oscillator frequency adjustment
Using the same configuration as for the delay line adjustment, disable the delay line and adjust C2015 until the dimensions of the spots are as small as possible on the vector diagram:
Luminance signal amplitude adjustment
To perform this adjustment, reconnect channel 1 of the oscilloscope to the CVBS signal on pin 1 of connector B1 (as described in the black-level adjustment above).
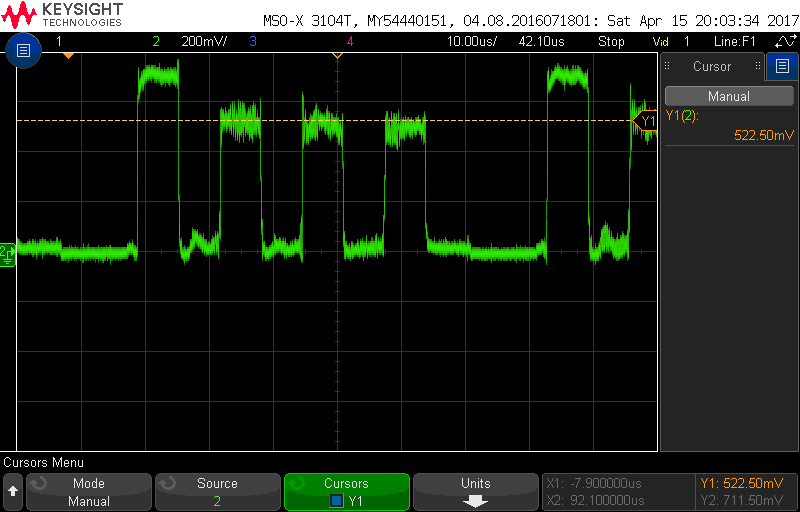
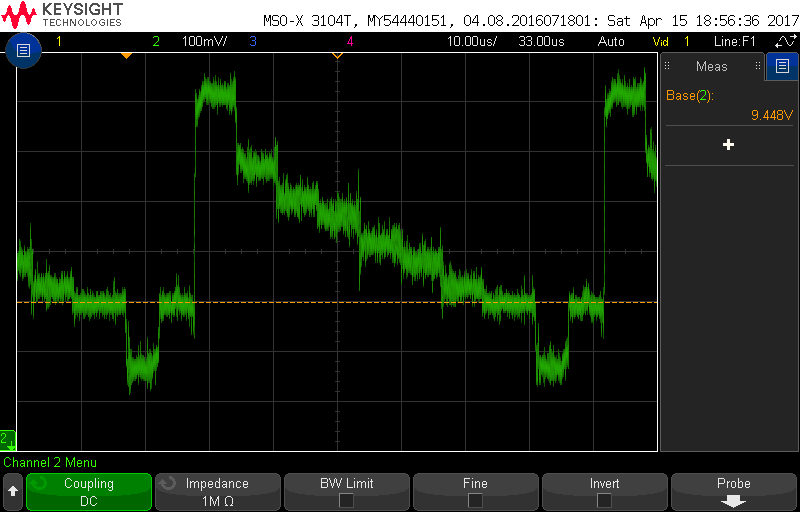
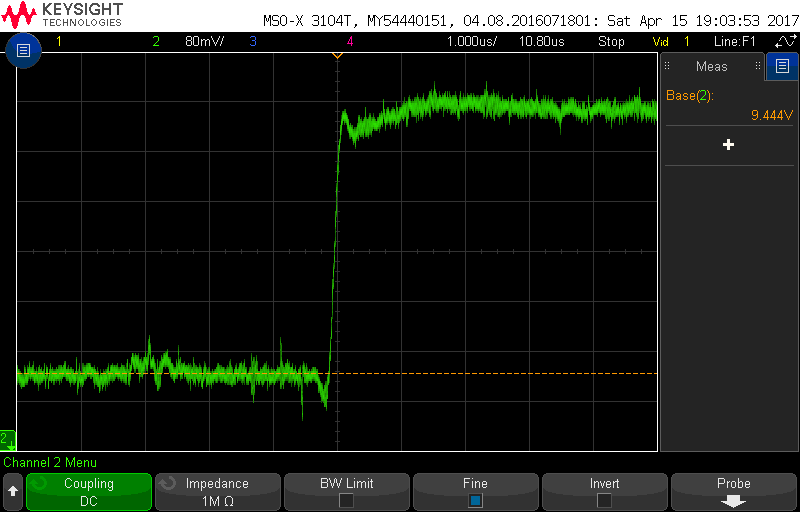
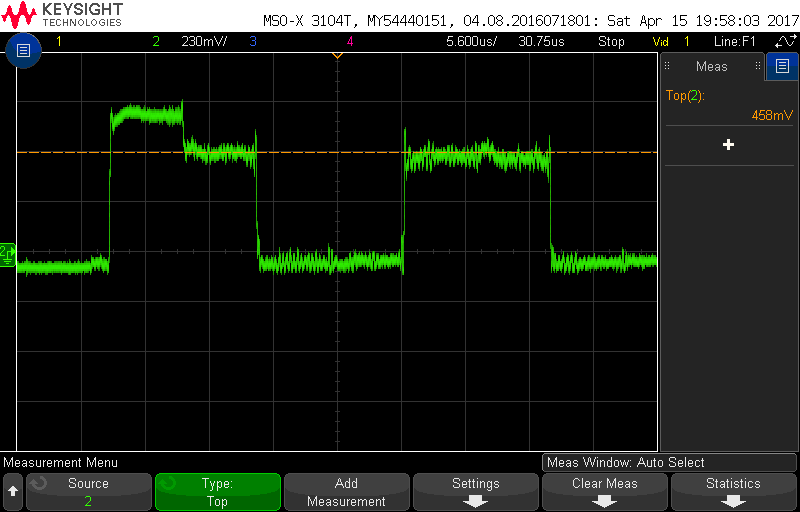
Connect channel 2 of the oscilloscope to the G-Signal (pin 3 of connector B3). The luminance of the G-Signal should also be adjusted to a peak of 700mV above the base-line black signal level by adjusting the 3080 potentiometer as shown in the following trace (note: the trace is zoomed in to the initial part of the signal):
Adjusting the colour difference signal amplitude of the R-Signal
Connect channel 2 of the oscilloscope to pin 2 of B3 (the R-Signal) and adjust the R-Signal (potentiometer 3082). For this adjustment the aim is to get the amplitude of the yellow signal to be as close as possible to the amplitude of magenta and red:
Adjusting the colour difference signal amplitude of the B-Signal
Connect channel 2 of the oscilloscope to pin 4 of B3 (the B-Signal) and adjust the B-Signal (potentiometer 3084). For this adjustment the aim is to get the amplitude of the cyan, magenta and blue signals to be as close as possible: